Enabling Tracing with Clang on z/OS
As a member of the zopen community, I get the opportunty to port a wide range of open-source tools to z/OS. It’s always exciting when you get a tool running smoothly on z/OS, especially when it makes your workflow easier. However, even in cases where everything seems to be working fine, performance issues or memory leaks can still creep in. While IPCS is great for deep-dive debugging, I’ve never been able to become proficient at it. I wanted something that was easier to use and more visual. In this post, I’ll walk you through how I addressed this using Clang’s instrumentation features and Perfetto’s trace visualization and show how you can easily apply them in your projects.
I start first with a dive into how I generated the trace data. If you’re not interested in the tracing implementation, you can skip over to Visualizing the Trace data using Perfetto for how to leverage it.
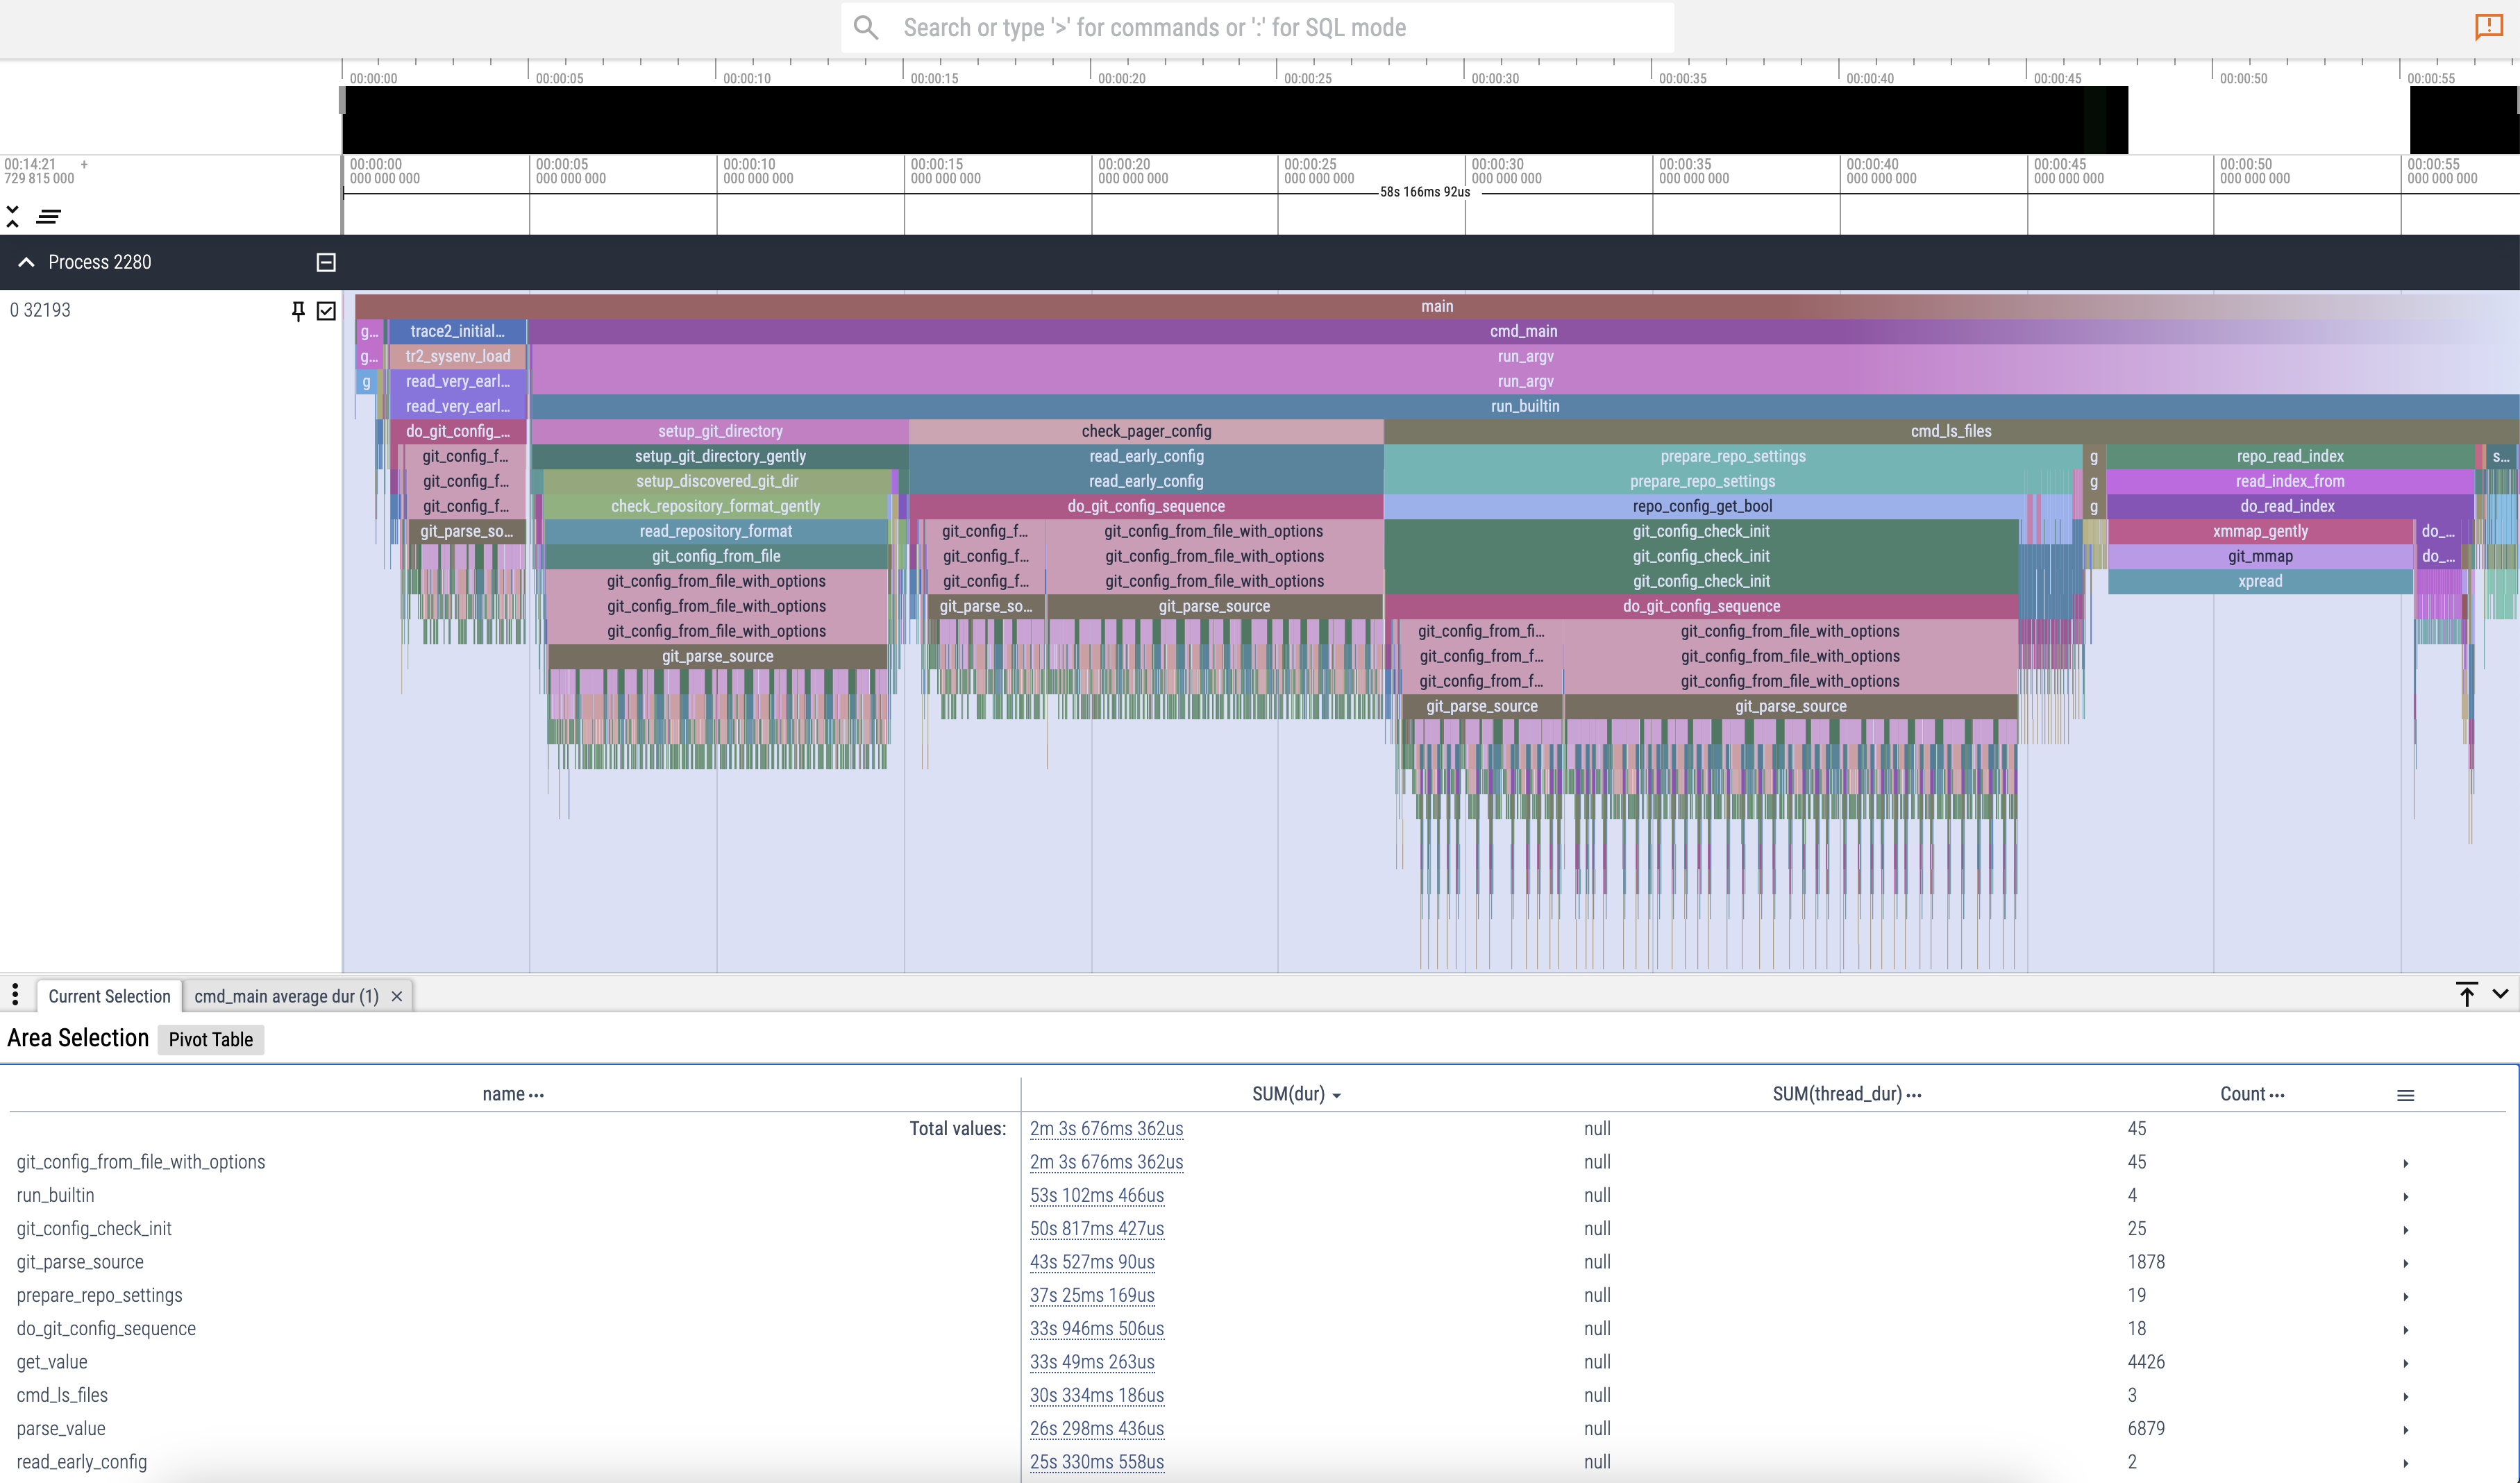
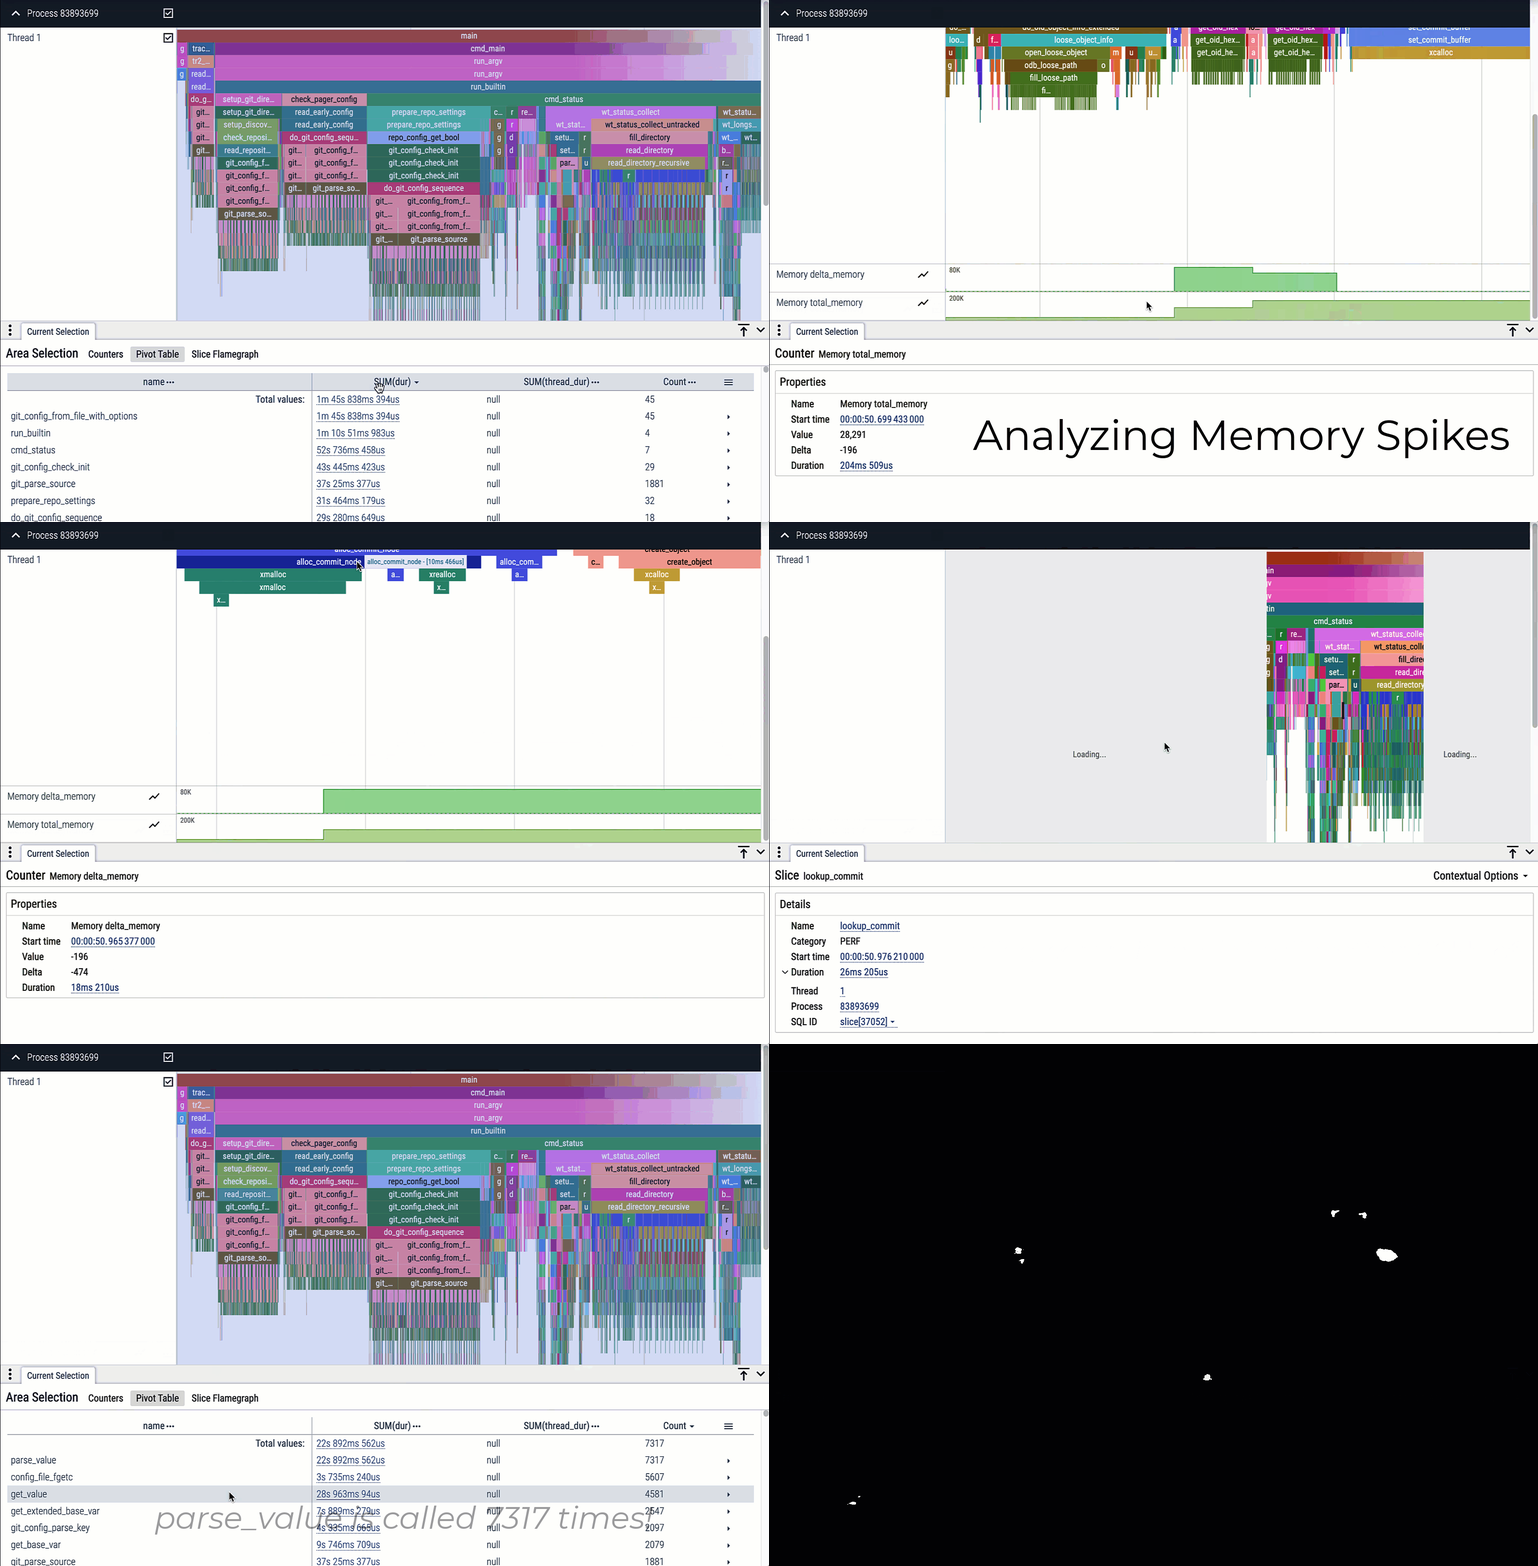
For the impatient, here’s a quick look at the end result:
Compiler Tracing with Clang
Before I started on this project, I did some research and discovered Clang’s -finstrument-functions feature, available in IBM Open XL C/C++. This compiler option automatically inserts instrumentation code at each function entry and exit point, making it possible to collect detailed tracing metrics. With the instrumented code, I could easily capture function names, timestamps, and other data, all of which are essential for profiling performance and understanding call flow. Another route I could have taken would have been to port the LLVM XRay instrumentation library, but that seemed like a lot of effort for an experimental project.
Integrating with zoslib
Clang’s -finstrument-functions feature only requires two functions to be implemented: __cyg_profile_func_enter and __cyg_profile_func_exit. By leveraging these, I was able to capture the function names using the Program Prologue Area (PPA1), along with the timestamps, process IDs (PIDs), and thread IDs (TIDs).
My initial implementation was simple and fairly effective:
1
2
3
4
5
6
7
8
9
10
11
12
13
14
15
16
17
18
19
20
21
22
23
24
__attribute__((no_instrument_function))
static void write_perf_data(const char* name, const char* phase) {
  pthread_mutex_lock(&__prof_mutex);
  fprintf(___file, "\"name\": \"%s\", \"ph\": \"%s\", \"pid\": %d, \"tid\": \"%d\", \"ts\": %lu\n", name, phase, getpid(), gettid(), get_timens());
  pthread_mutex_unlock(&__prof_mutex);
}

__attribute__((no_instrument_function))
void __cyg_profile_func_enter(void* this_fn, void* call_site) {
  __stack_info si;
  void *cur_dsa = dsa();

  __iterate_stack_and_get(cur_dsa, &si);
  write_perf_data(si.entry_name, "B");
}

__attribute__((no_instrument_function))
void __cyg_profile_func_exit(void* this_fn, void* call_site) {
  __stack_info si;
  void *cur_dsa = dsa();

  __iterate_stack_and_get(cur_dsa, &si);
  write_perf_data(si.entry_name, "E");
}
After successfully testing the prototype, I integrated it into zoslib, a foundational open-source library for building C/C++ projects on z/OS.
Zoslib is linked into 99% of the C/C++ projects within the zopen community. If you want to learn more about zoslib, check out my other blog here.
Standardizing Trace Data Format
While the prototype was definitely a step up over what I had before, it was still difficult and time-consuming to analyze the data. I needed to generate the trace data into a more consumable format. One such standardized format is the Chrome Tracing JSON format. This format offers several advantages:
- Readability on z/OS via the
jqcommand since the trace data will be in json. - Compatibility with Chrome’s built-in tracing feature and Perfetto open source.
Trace Data Structure
The Chrome Tracing format stores each function call as a JSON object with these attributes:
- Function name
- Timestamp
- PID
- TID
- Phase (“B” for function entry, “E” for function exit)
To make the traces more manageable, especially for long-running applications, I implemented automatic gzip compression. After the trace is generated, a check ensures that gzip is available, and if so, the trace file is compressed. This keeps the file sizes under control, but if gzip fails for some reason, the trace file remains uncompressed, and the application continues as normal.
Next Step - Tracking Memory Allocations
Another pain point for me on z/OS was tracing memory allocations. IPCS is powerful, but again I needed something more accessible for memory footprint analysis. So, I figured why not extend this tracing to handle memory management too?
So that’s what I did. I implemented custom overrides for malloc and free to trace and track heap memory spikes and allocation patterns.
Implementation
The current implementation is available in zoslib here
And here’s an example of the generated json for git on z/OS:
1
2
3
4
5
6
7
8
9
10
11
12
13
14
15
{ "traceEvents": [
  {"cat": "PERF", "name": "zoslib_env_hook", "ph": "B", "pid": 83893699, "tid": 1, "ts": 582917421},
  {"cat": "malloc", "name": "Memory", "ph": "C", "pid": 83893699, "tid": 1, "ts": 582922816, "args": {"delta_memory": 1024, "total_memory": 1024}},
  {"cat": "free", "name": "Memory", "ph": "C", "pid": 83893699, "tid": 1, "ts": 582928703, "args": {"delta_memory": -1024, "total_memory": 0}},
  {"cat": "malloc", "name": "Memory", "ph": "C", "pid": 83893699, "tid": 1, "ts": 582929642, "args": {"delta_memory": 1024, "total_memory": 1024}},
  {"cat": "free", "name": "Memory", "ph": "C", "pid": 83893699, "tid": 1, "ts": 582934379, "args": {"delta_memory": -1024, "total_memory": 0}},
  {"cat": "malloc", "name": "Memory", "ph": "C", "pid": 83893699, "tid": 1, "ts": 582935145, "args": {"delta_memory": 1024, "total_memory": 1024}},
  {"cat": "free", "name": "Memory", "ph": "C", "pid": 83893699, "tid": 1, "ts": 582940290, "args": {"delta_memory": -1024, "total_memory": 0}},
  {"cat": "malloc", "name": "Memory", "ph": "C", "pid": 83893699, "tid": 1, "ts": 582941020, "args": {"delta_memory": 1024, "total_memory": 1024}},
  {"cat": "free", "name": "Memory", "ph": "C", "pid": 83893699, "tid": 1, "ts": 582942273, "args": {"delta_memory": -1024, "total_memory": 0}},
  {"cat": "malloc", "name": "Memory", "ph": "C", "pid": 83893699, "tid": 1, "ts": 582942975, "args": {"delta_memory": 1024, "total_memory": 1024}},
  {"cat": "free", "name": "Memory", "ph": "C", "pid": 83893699, "tid": 1, "ts": 582949534, "args": {"delta_memory": -1024, "total_memory": 0}},
  {"cat": "PERF", "name": "zoslib_env_hook", "ph": "E", "pid": 83893699, "tid": 1, "ts": 582950330},
  {"cat": "PERF", "name": "main", "ph": "B", "pid": 83893699, "tid": 1, "ts": 582970044},
  ...
Visualizing the trace data using Perfetto
Once I had the mechanism in place to generate trace data into a standardized format, the next step was analysis. This is what led me to Perfetto, an open source trace visualization tool that offers an interactive UI to inspect your program’s execution in detail.
Perfetto is really easy to use. It lets you zoom in on specific timeframes, analyze function call stacks visually, and filter events by category or thread. It even supports SQL queries on your trace data, which opens up a lot of possibilities for custom analysis.
Here’s a look at the performance visualization for git status:
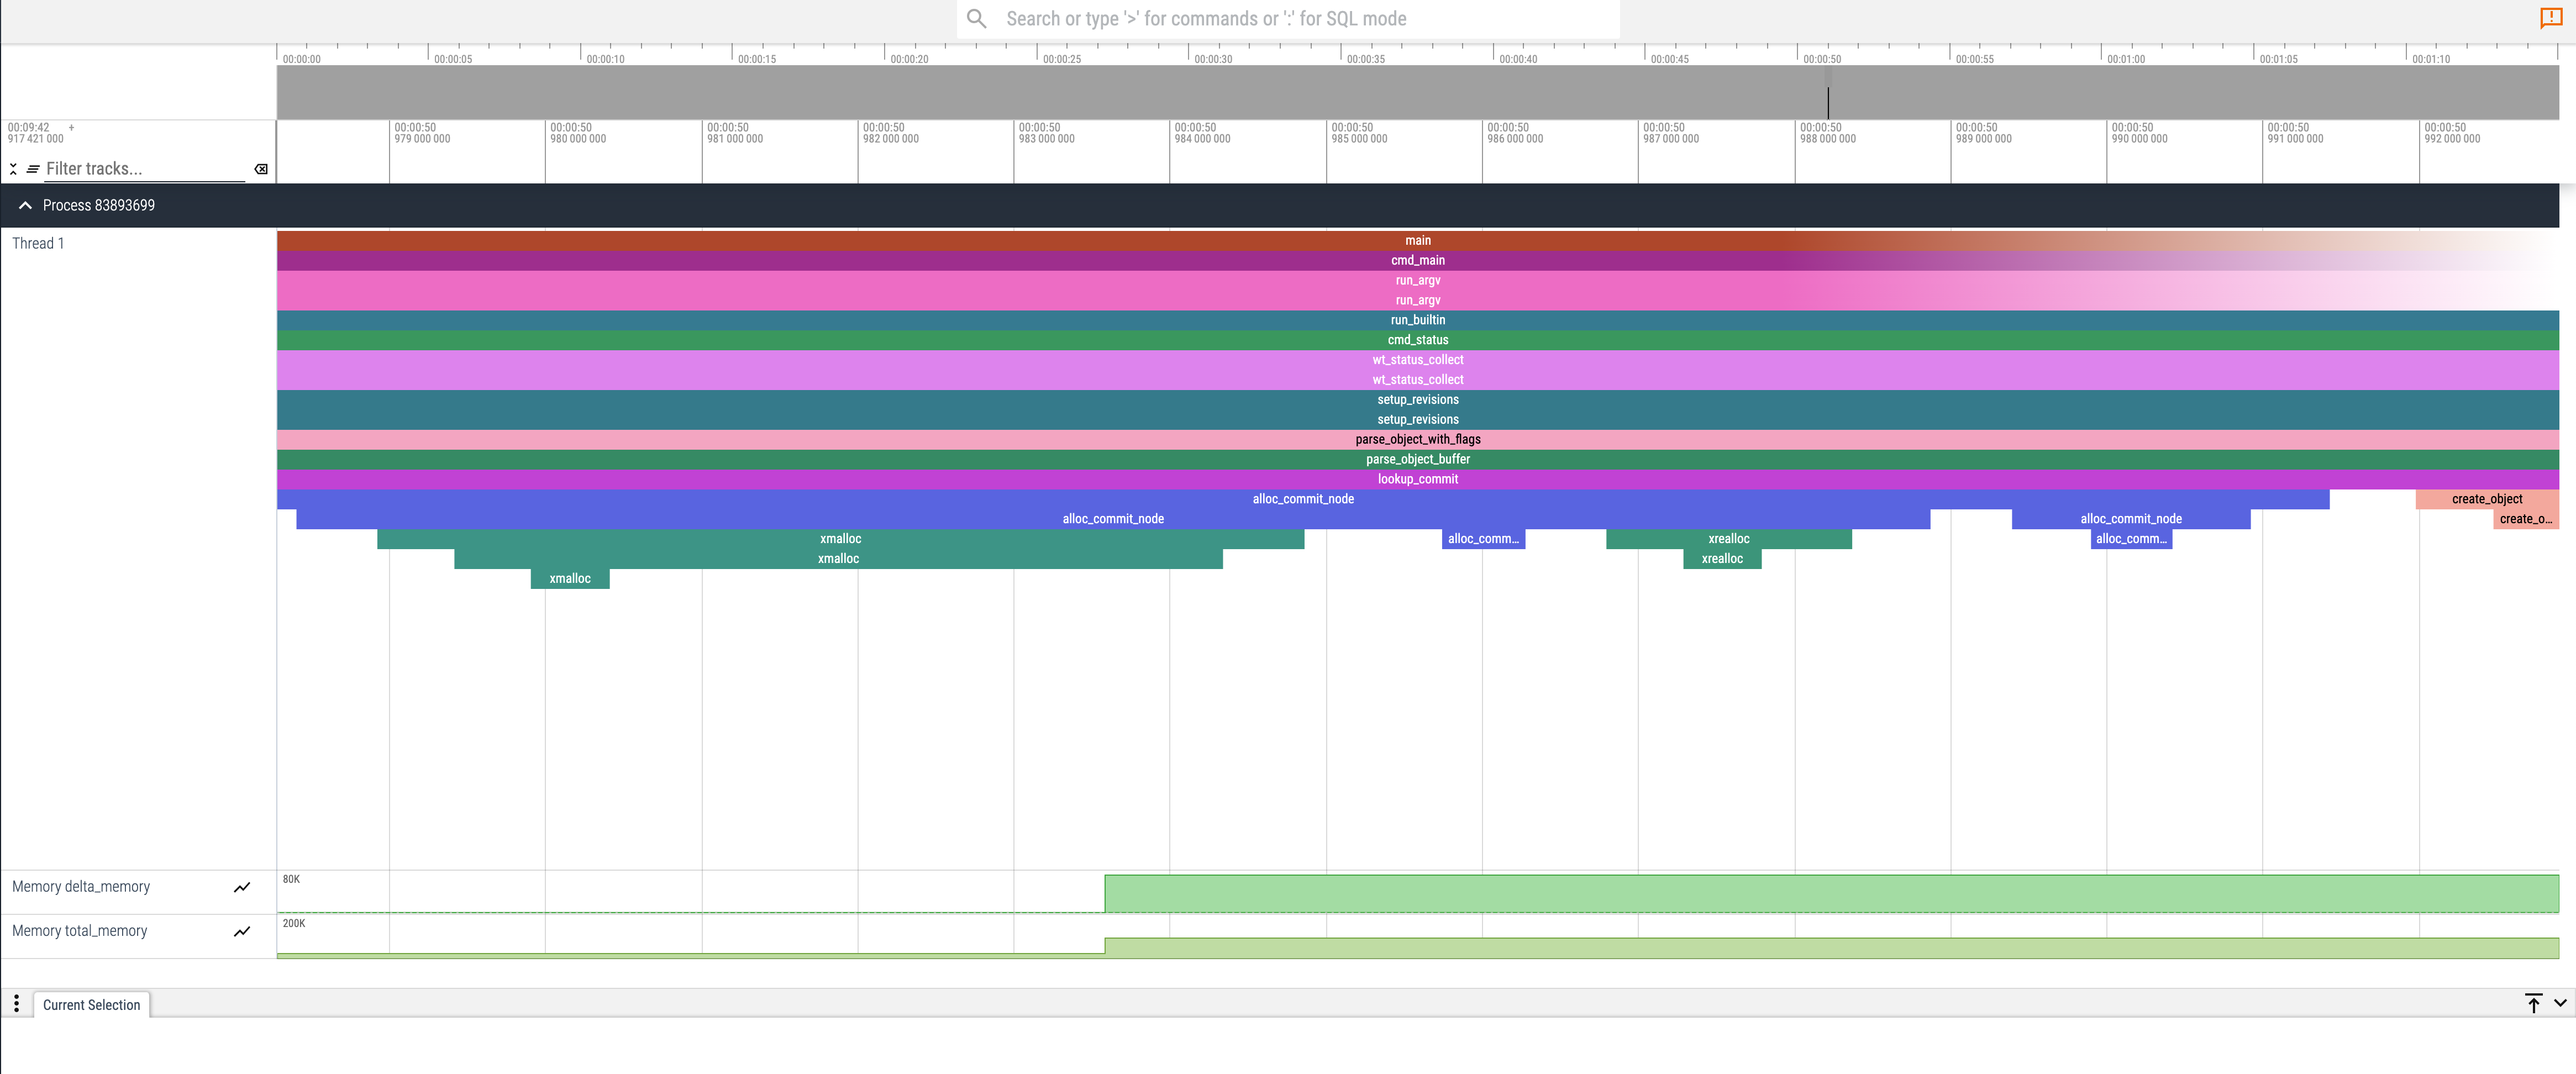
With Perfetto, you can visualize your program’s entire call flow and easily track memory spikes.
How to leverage the tracing in zopen tools
Using zopen build –instrument for Easy Tracing
While this was great, I now wanted a way to make it easy for everyone contributing to zopen to leverage this tracing capability.
So, I incorporated this functionality into the zopen build framework by adding a --instrument option:
1
zopen build --instrument
With this option, the open source project is built with instrumentation enabled (applies only to C/C++ projects).
Then, when the instrumented application runs, it generates a
Viewing Trace Data
Now that you have a trace file, the next step is to perform the analysis.
To view the trace data, there are two approaches:
- Manual inspection of the json
- Using perfetto (preferred)
Manual inspection:
- Using zcat and jq: You can decompress and inspect the JSON trace data directly from the command line:
1
zcat <application>-<timestamp>.json.gz | jq .
Using Perfetto UI
The json file can be loaded into the Perfetto UI for a detailed view of the execution.
Steps to view traces in Perfetto UI:
- Visit the Perfetto UI using a browser.
- Download the generated json.gz file from z/OS and then click on ‘Open Trace file’ in the Perfetto UI.
- Explore the timeline to see detailed function calls, filter by specific processes or threads, and identify bottlenecks.
You can use the W/A/S/D keys to maneuver around.
Using Perfetto, I could now visually identify spikes in memory footprint and identify the culprit functions:
Using the SQL Query engine for custom analysis
Perfetto also offers a Python library, which I haven’t had the chance to explore yet, but it opens up the possibility for custom analysis and even integrating with large language models (LLMs) for deeper insights.
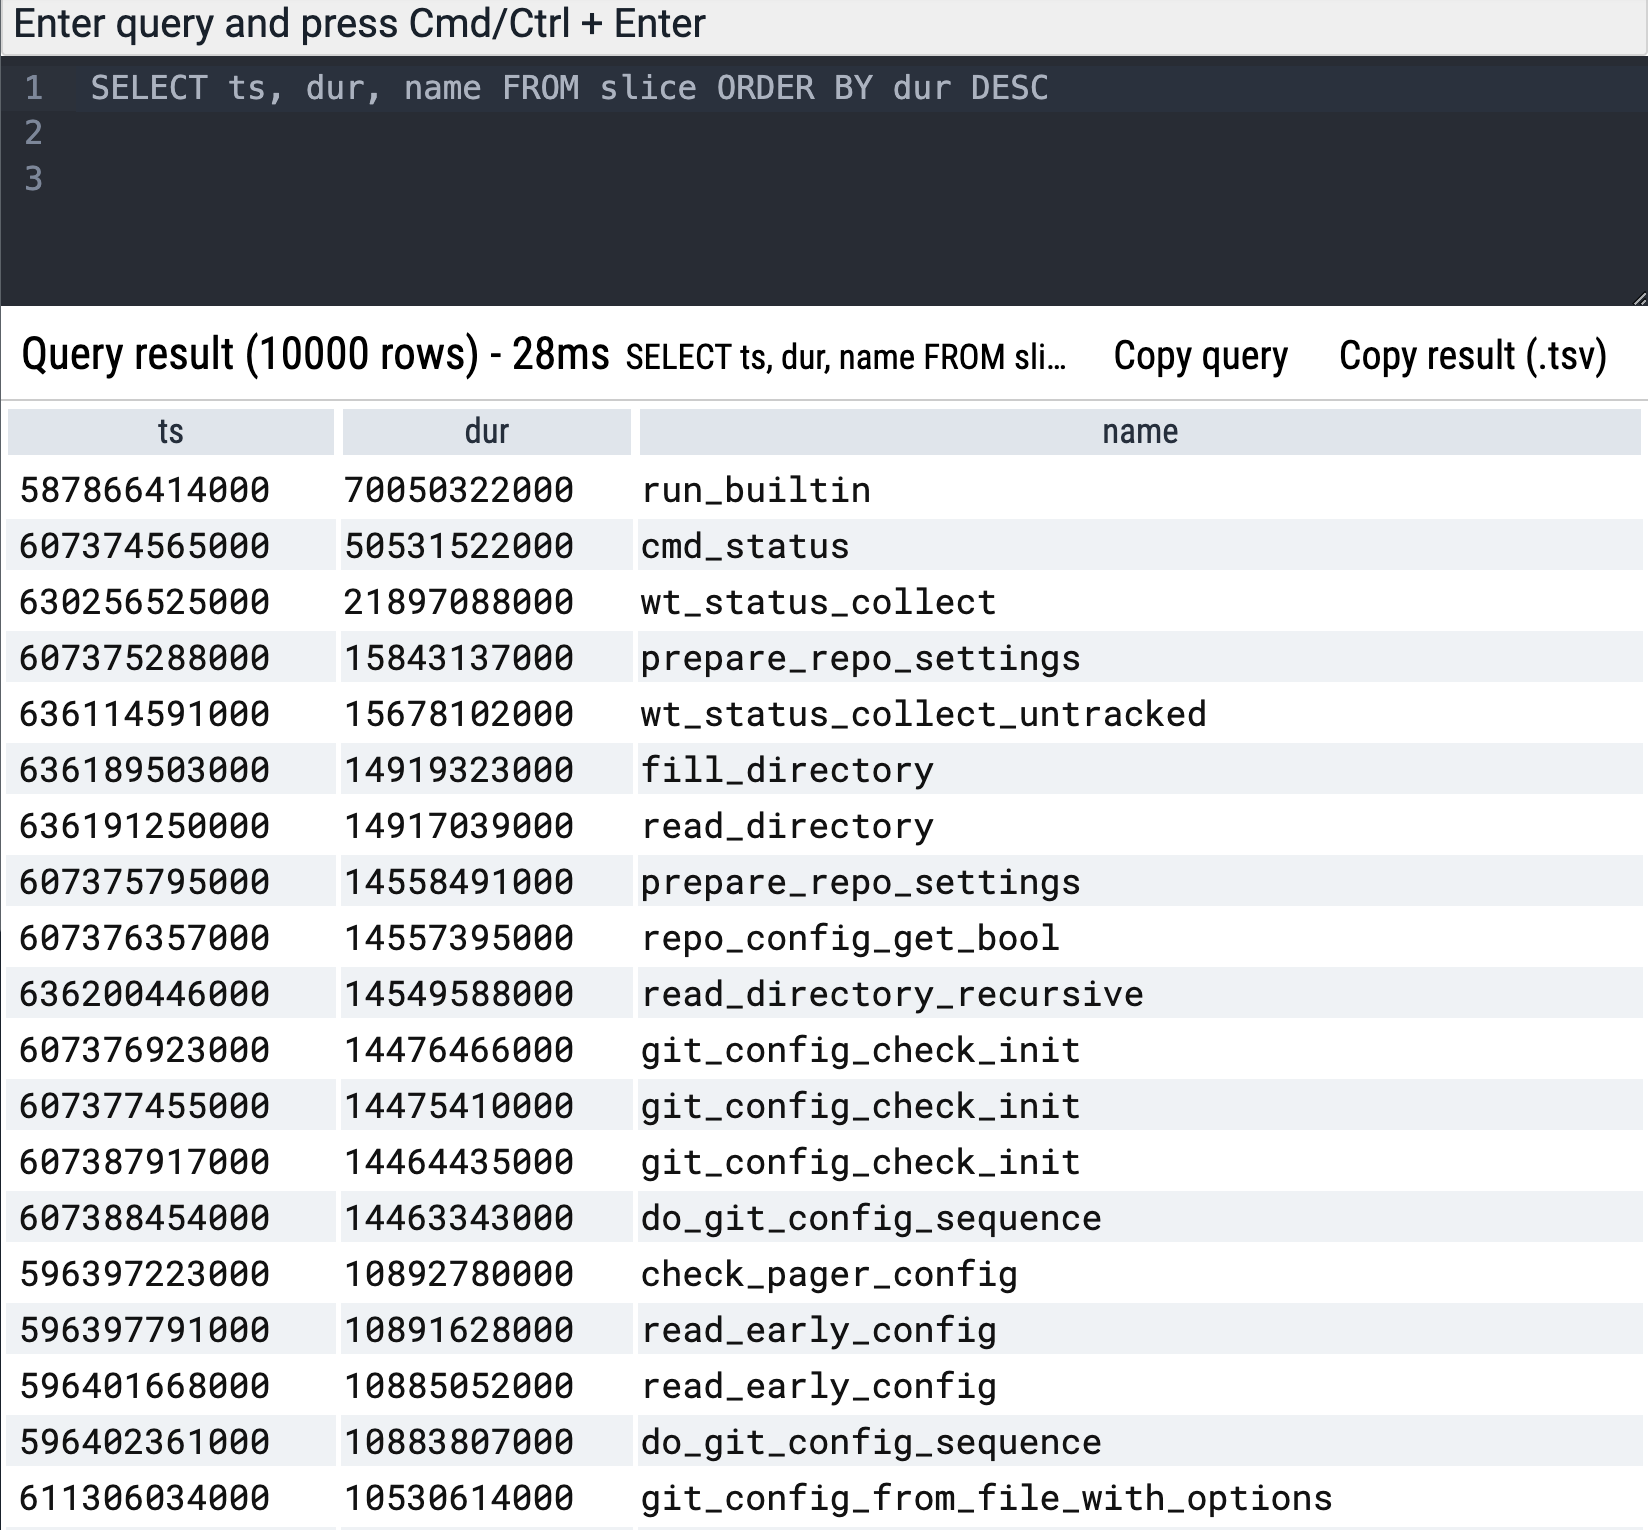
Additionally, Perfetto’s built-in SQL query engine allows you to easily locate long-running tasks and perform advanced data queries. Here’s a simple example to find the longest-running functions:
1
SELECT ts, dur, name FROM slice ORDER BY dur DESC
This makes it easy to dig into specific performance bottlenecks and get a more granular view of your application’s behavior.
Next Steps
This project started as an experiment but has proven to be valuable (for me at least) in quickly detecting performance and memory issues in zopen tools. Moving forward, I’m excited to explore how we can further improve this approach and track additional metrics that could enhance our analysis and optimization efforts.
If there’s enough interest, I hope to present this in the next zopen guild meeting!
And of course, there’s always more to do - like figuring out why Git is allocating 80KB of memory!

Conclusion
Thank you to Mike Fulton, Haritha D and everyone from the zopen community, and especially to the IBM Open XL C/C++ team for providing an awesome C/C++ compiler for z/OS!
-
Previous
Enhancing Vim on z/OS UNIX with Language Server Protocol (LSP) support -
Next
Optimizing Git Performance on z/OS
